Researching the Performance costs of JavaScript MVC Frameworks
At Filament Group, we’ve been very focused on website performance. We’ve long been curious about the performance of popular JavaScript MVC frameworks such as Angular, Backbone, and Ember, primarily because they offer elegant solutions to complex problems and we want to be able to use them in our own client work. These frameworks promise speed and developer convenience once up and running, but there is an initial cost in downloading, parsing, and executing a fairly large payload of JavaScript, particularly when the JavaScript is used to generate the HTML content for the site.
Update: Data for React and Ampersand were added to this post's graphic after we initially published it. That data can also be found in the spreadsheet.
Speed matters
Permalink to 'Speed matters'As an industry, we know that perceived website page load speed is critical to visitors. In one study, 47% of users expected web pages to load in under two seconds and 57% said they will abandon a page if its load time is 3 seconds or more. Google even considers page speed a factor in its search rankings.
On a fast, reliable wifi connection, the wait for a usable page can often be minimal. But what happens in the browsing conditions that real users deal with every day?
Statistics (from the GSMA) show that only 20% of N. America customers have LTE enabled handsets. Globally, the LTE penetration rate is ~5%. 3G networks are still the norm, not the exception - Bursting our Bubble: Mobile Performance Outside the First World
While developers here in the US may enjoy speedy 4G/LTE connections, lower-end networks are still the norm—even in developed portions of the world. Heck, Scott here still has only a 2G connection speed at his home with T-Mobile! [Insert Florida joke here]
But cell network latency (and Florida jokes) aside, mobile devices tend to be very slow at parsing and executing JavaScript as well. Google even suggests our sites should render within one second: can popular MVC frameworks deliver?
Initial loading time matters
Permalink to 'Initial loading time matters'One aspect where these frameworks often perform well is in subsequent page visits, as the frameworks are designed to re-render pages quickly with minimal server or network dependence. Of course, initial loading time (or the time it takes to load when you first visit a site) is arguably more important, especially in the age of links shared via social media: without a successful first visit, there are no subsequent visits.
What we wanted was a way to compare the initial load times of these frameworks in a more realistic manner than just looking at their file sizes.
Our testing setup
Permalink to 'Our testing setup'Fortunately, the TodoMVC project has examples of the exact same application, built implemented across a wide range of popular JavaScript MVC frameworks. This provided us with a minimal, application: no second loads, few assets, and minimal logic to use in our tests.
The TodoMVC examples aren’t ‘production ready’ because they’re targeted at developers who want to see how the application is built with a given framework. To approximate a realistic production environment we pulled down the TodoMVC code samples, concatenated files, applied minification, served the assets with compression, and moved the host closer to the test location [1].
We ran our tests using WebPageTest.org and Andy Davies’ bulk testing spreadsheet. We did 20 runs for each browser and connection, discarding extreme outliers [2]. We tested a desktop browser (Chrome) and a mobile browser (Android Chrome) both at 3G, and the desktop again at Cable speeds, all from the Dulles, VA data center. The two desktop Chrome tests give us an opportunity to see the impact of different network conditions with the same browser; the Nexus 5 test gives us a view of what a modern Android phone with a 3G connection could experience.
Metric
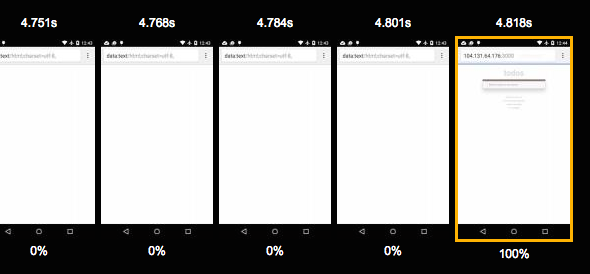
Permalink to 'Metric'Of all the numbers collected, we were most interested in render start. This is the moment in the WebPageTest timeline view where the Todo application’s UI first appears. It’s also the earliest point that a user could conceivably report the application “ready to use.” In other words, before the render start time, visitors will be staring at a blank screen; this filmstrip view of the Ember demo illustrates it nicely, simulating a Nexus 5 over 3G:
Digression
Permalink to 'Digression'It’s important to be clear about what the tests can and can not tell us about these frameworks.
First, these tests are intended to establish a reasonable “best case scenario” on initial load and render times for each framework, tested under three different network/device conditions. Chrome (the browser we used for the testing) is one of the fastest, most standards-compliant browsers in the world, and given how simple TodoMVC’s functionality is, it’s unlikely these frameworks will have significantly better initial load times for more feature-rich applications. So if the results here look too slow, a more complex application might be even slower.
Second, these tests are not a comparison of render start times between frameworks. Low render start times for a given framework for one application do not imply that all applications built with that framework will have low render start times. For example, it’s possible that the abstractions in Angular and Ember could reduce overall code size through re-use as application complexity increases.
Update: we’ve since collected data for Ember 1.9, which can be viewed in the spreadsheet linked below. The numbers are comparable.
Results
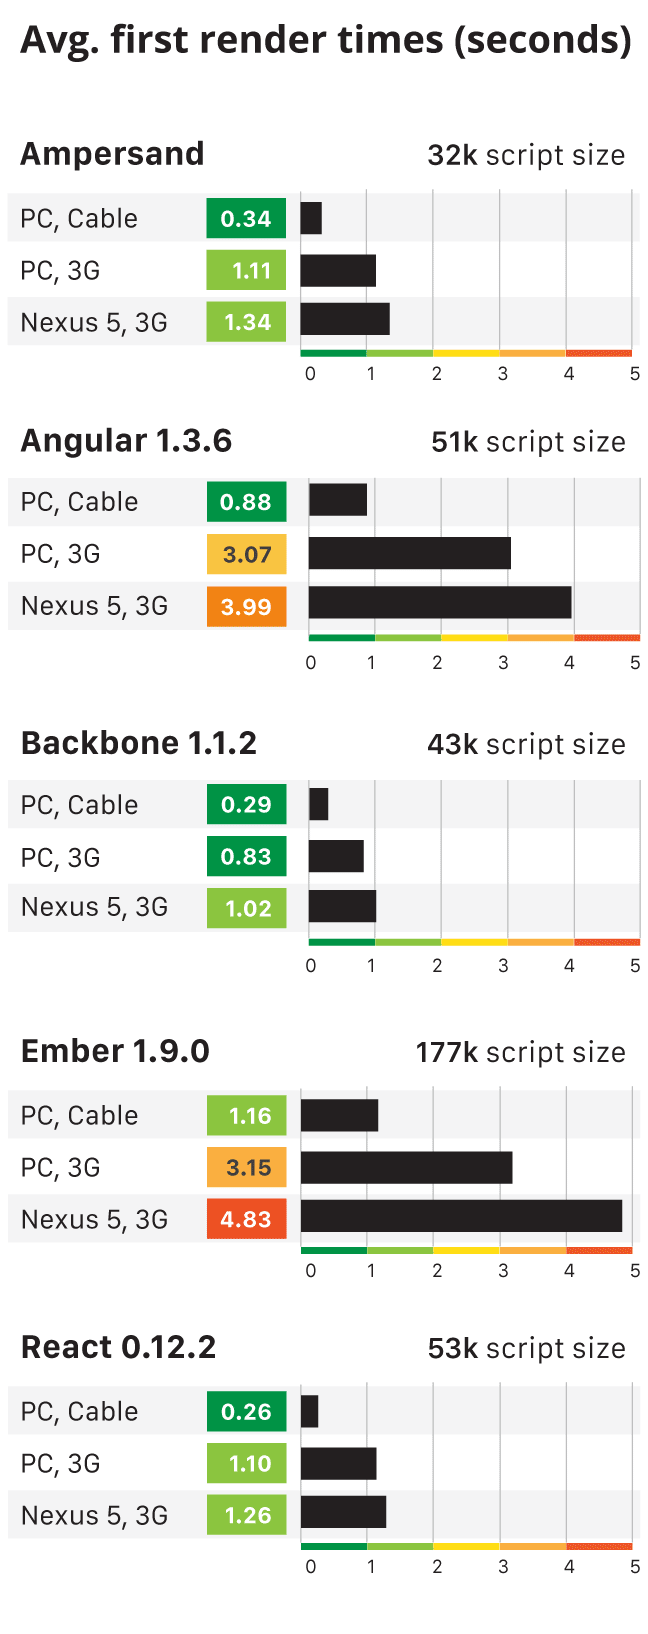
Permalink to 'Results'The data is available for inspection, but the following stood out to us:
- Ember averages about 5 seconds on 3G on a Nexus 5 and about 3 seconds 3G in desktop Chrome.
- Angular averages about 4 seconds on 3G on a Nexus 5 and about 3 seconds 3G in desktop Chrome.
- Backbone appears to be the only framework with workable baseline performance on all connections.
- Looking at the difference between the Nexus 5 and the Chrome desktop over 3G suggests that the execution time required to get the application on screen plays a significant roll in the overall render start performance for Angular and Ember [3].
Conclusion
Permalink to 'Conclusion'We encourage you to take a look at the tests and data for yourself and draw your own conclusions. At the very least, it suggests that if initial load times are an important criteria in your consideration of tools, you may not be able to make use many of these tools today.
But we have reason to believe that will improve in the future. There are practical approaches we can already use today to reliably produce very fast rendering times, but they work best when HTML content is delivered from the server side rather than generating it solely on the client. That approach benefits many areas of user experience aside from performance alone, and we plan to write more about that in a followup post.
But in the meantime, it’s incredibly encouraging to see that the authors of frameworks like Ember are starting to acknowledge this issue. We can’t wait to see where the next few months take us.
Footnotes
Permalink to 'Footnotes'- Repository and test details. In particular note that the host “Droplet” was in one of Digital Ocean's NYC data centers in the interest of *simulating* CDN conditions. 80ms for TTFB on a cable connection is reasonable in our experience.
- Extreme outliers here is defined as a 2× *worse*. This generally only happens when something goes wrong with the test.
- Ideally we could test the Nexus 5 at faster connection speeds but that's currently not an option on WebPageTest.org.
Also, a special thanks goes to Ethan Marcotte for proofreading initial drafts of this post.