More Weight Doesn't Mean More Wait
When I talk about web performance, I like to use the phrase, “weight does not need to increase wait.” To be clear, that’s not because the weight of a webpage doesn’t matter—it most definitely does—but rather because we can often (usually, even) deliver a usable representation of a web page’s content very quickly, even if that page is quite large and asset-heavy as a whole. At the root of this distinction is a performance metric that the web community has only recently begun to discuss and prioritize, known as perceived performance.
Formerly, much of the focus in web performance was concerned with optimizing assets like images and fonts, which does make for a shorter overall page load time. But today there are techniques we can use in addition to file optimization that have an arguably larger impact on how soon our users can see and use the content we’re delivering.
Measuring Overall & Perceived Performance
Permalink to 'Measuring Overall & Perceived Performance'Part of the reason we hadn’t focused heavily on perceived performance in the past was due to a lack of good tools to analyze the events that take place while our pages load. Nowadays, that’s hardly the case.
Amongst a few others, WebPageTest.org sits at the top of the list of tools I find irreplaceable in profiling performance today. In short, WPT’s web interface allows you to test a site in a variety of browser/device/location combinations and receive loads of rich information about how that site loaded and what you can do to improve it.
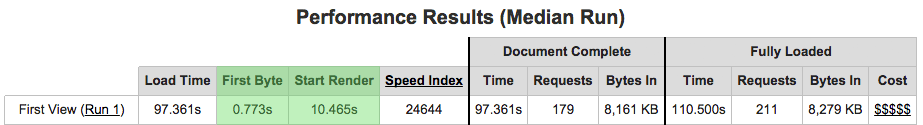
Here’s a glance at the summary table you see when you run WPT on a site, in this case, I tested an article page on the new responsive Wired.com on a 3G connection from an Android device in Dulles, Virginia, USA using the Chrome browser:

A quick note: I should point out here that while this particular example website can use some performance improvements, this post is not meant to be a critique of Wired's site specifically. In truth, most sites of that scale perform similarly to this one, so it's just one of many examples we could use.
This summary table provides some useful numbers, like:
- Overall page load time: the time it takes all of the page’s assets to finish loading
- Overall page weight: the combined weight of the page’s HTML and all the files that it references (CSS, javascript, images, fonts, etc.)
There’s even a new column telling you how much that page costs to load in various parts of the world (which ties into Tim Kadlec’s excellent site, WhatDoesMySiteCost.com). This particular page weighs in at 8-9 megabytes including all of its assets and advertising (its weight seems to vary depending on the ads in play), which costs over $1 dollar (US) to access, even in developed regions of the world like Germany!
The metrics mentioned above represent areas we’ve traditionally looked to when reviewing performance at a high-level. They’re areas that we can dramatically improve by optimizing our file sizes (images, fonts, JavaScript, CSS) and minimizing the number of third party sites we reference for ads and social widgets.
However, there are also values in the summary table that tell us a bit more about how fast a site feels, and how soon it can be used. Fortunately for us, a site can typically be used long before it has finished loading, so again, the weight doesn’t need to impact the wait!
For measuring perceived performance in WPT, I tend to look at these values:
- Time to first byte: the time it takes for the site to return the first byte of its response content
- Start render: The time at which a site’s content starts to visually display in the browser
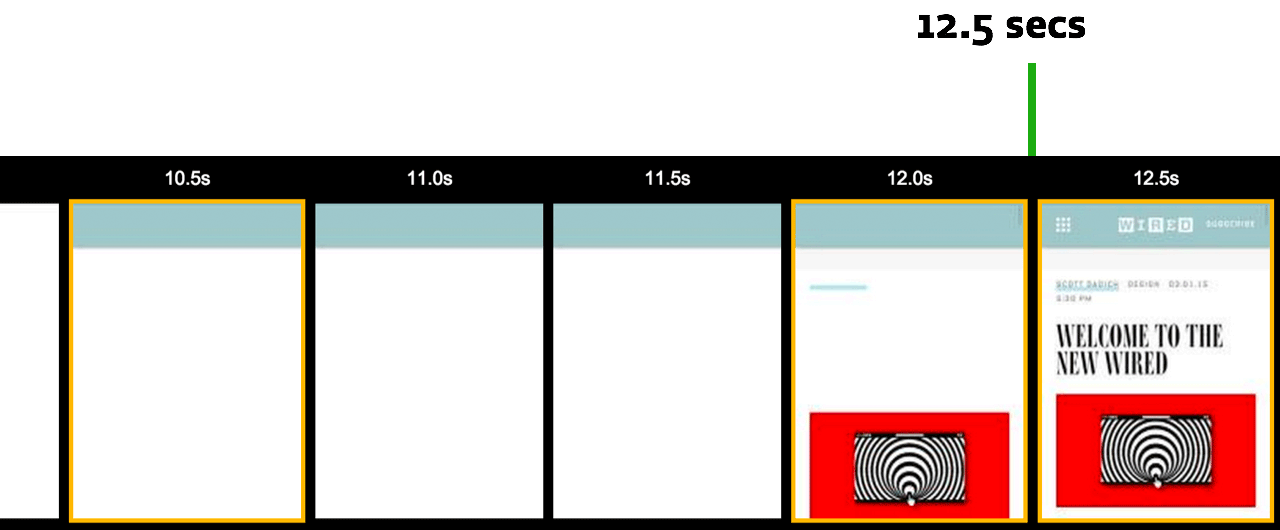
Also useful for this is WPT’s timeline view, which lets us see how the page progressively renders over the course of recorded keyframes. Here’s an abbreviated version of that page’s timeline, viewed at intervals of 500 milliseconds and cropped to show the important rendering steps:

The timeline view is particularly handy because it gives a little more meaning to your initial rendering steps. In this case, the page starts rendering after about 10.5 seconds but there’s no content until about 14 seconds. That’s a long time to wait around on your phone!
Improving Perceived Performance
Permalink to 'Improving Perceived Performance'In viewing the time to first byte, we get some insight into the time the web server takes to process a request from a given location and connection speed, and perhaps how much network latency is factoring into the round trip to the server and back (which is, as Ilya Grigorik kindly points out, the web’s current performance bottleneck).
First byte time can be reduced in a number of ways (none of which are likely to be easy), such as shortening the time a server spends handling a request, updating your SSL configration, and delivering static HTML responses when possible. Maybe most importantly, distributing your code throughout the world using a CDN (like Cloudflare, Fastly, etc.) will have a huge impact on time to first byte because the physical distance between a user and the remote web server matters a great deal. WPT’s waterfall view gives us some information about how much time is spent in DNS lookup and while negotiating SSL so you can see how much of that time to first byte was spent in each phase of the round trip.

As for reducing start render time, the bottlenecks are often on the client-side, in the way we write our HTML. That’s because the ways in which an HTML file references external CSS and JavaScript files frequently causes the browser to stop visually rendering the page until it finishes loading and parsing those files.
To figure out which files are referenced in render-blocking ways, we can look at that waterfall chart again. The green vertical line in the image represents the point when the page starts to render. We can see requests to the left of that line that are potentially causing that rendering to happen later. These are files we’ll want to focus on first, since they may be blocking rendering.
A better tool for identifying render-blocking resources is Google’s PageSpeed Insights. Just like WPT, you can submit a URL and PSI will give you a performance score (1-100), and tips for improving that performance. Below is a screenshot of PSI’s advice for this particular page to “Eliminate render-blocking JavaScript and CSS.” PSI found 3 blocking CSS files and 3 blocking JavaScript files, all of which present a potential single point of failure for rendering the page in a timely manner.

Anything we can do to request those files in a non-blocking manner will help the browser to start rendering the page sooner.
Improving Start Render
Permalink to 'Improving Start Render'A page with no external JavaScript or CSS references can start rendering as soon as it arrives, and so can one that references external JavaScript and CSS in a non-blocking manner. From a technical standpoint, that means requesting files asynchronously, or… not requesting them externally at all!
With regards to JavaScript, this is where we start to consider things like moving our JavaScript references to the end of the document, adding async and defer attributes to our script tags, or using a small bit of inline JavaScript to request them dynamically (which is useful if you want to qualify an asynchronous request based on browser features, by Cutting the Mustard).
With regards to CSS, this is where we start to consider things like inlining the most important, or “critical” portion of our CSS rules in the head of the page and requesting our site’s full stylesheet asynchronously. The latter is more difficult than it should be. That’s because unfortunately, it doesn’t matter where you place a link in your document… unlike JavaScript, a stylesheet reference is going to halt rendering as soon as it takes flight in most browsers. (This little bit of JavaScript in the head of your page is the best we can do for async CSS loading for now, but hopefully the standards will improve with link element attribute additions soon enough).
This process of moving our JavaScript and CSS to a non-render-blocking delivery is detailed in our post How we make RWD sites load fast as heck. Go there to read more about it, and be sure to check out Jeremy Keith’s followup of how we implemented our recommendations for one of his own sites.
Let’s not forget the fonts…
Permalink to 'Let’s not forget the fonts…'There’s one more thing we think about with regards to improving start render: custom font loading. Unfortunately, when custom fonts are in play much of our start render tuning can be for naught, particularly in browsers like iOS Safari. That’s because most browsers will hide the text in the page that uses a custom font until that font has finished loading, meaning the initial rendering of the page is pretty much useless, no matter how fast it draws.
To fight this behavior (and make users happy!), we recommend employing a progressive approach to rendering fonts so that text renders immediately in a fallback font while custom fonts are still being fetched. When doing this, it really helps to style your fallback fonts to match as closely as possible in size and spacing to the custom ones so the reflow between the two is minimized.
Here’s a recent post that explains how we do that here at FG: Font Loading Revisited with Font Events. And while you’re thinking about font loading, check out Ilya Grigorik’s latest post, “Fixing the Blank Text Problem,” which makes the case for an upcoming CSS property that will help us manage custom font loading with much less work.
Back to Weight vs. Wait!
Permalink to 'Back to Weight vs. Wait!'To illustrate just how much these perceived performance optimizations can help, I applied them to a copy of that Wired article page analyzed above. To compare the before and after results fairly, I ran tests on the rendering time of an unchanged copy of the page and an optimized copy of the page, both hosted on one of our servers. The copied version of the page references the same external third-party assets and has almost identical performance timing to Wired’s real page, but it’s important to note that these optimizations are just a proof of concept and not applied to the actual Wired site. Actual results would vary a bit, but we can still get an idea of how much they’d help.
First, here’s a WPT timeline view the unedited copy of that page on our servers, tested on 3G connection in Android Chrome. I’ve cropped it to show the relevant portion of the timeline where the page starts to become usable (click the image to see it in full if you’d like):
A timeline of the copied version of the live web page, with a first usable render at about 12.5 seconds.
Okay good, the render timing is fairly similar. This copy of the page is slightly faster, probably because I’m serving a static copy of the HTML and it seems to have a faster turnaround time on our servers, among other things. That said, it’s close enough for our purposes.
Next I applied some optimizations to that page, like:
- Extract and Inline “Critical” CSS
- Load full StyleSheets asynchronously (cached for return visits)
- Load all JavaScript asynchronously (yes, ads too!)
- Load fonts asynchronously and apply them in a progressive manner (fallback first)
- Style fallback fonts to match custom font sizes
And here’s how it turns out. Here’s the optimized version tested in WPT under the same conditions as above (3G connection, Android Chrome), once again cropped to show the most relevant portion of the timeline:
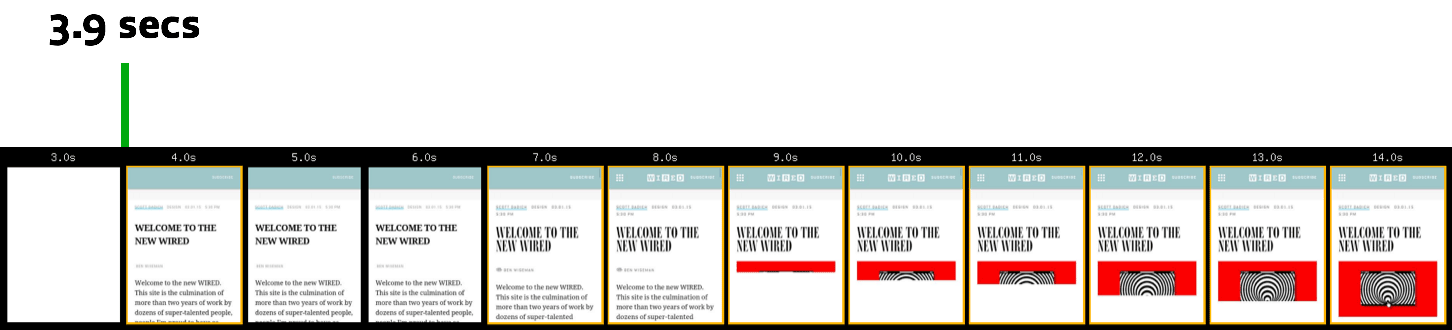
A timeline of the copied version of the live web page, with a first usable render at about 3.9 seconds.
That’s a full 8.5 seconds faster! Here’s a comparison view:
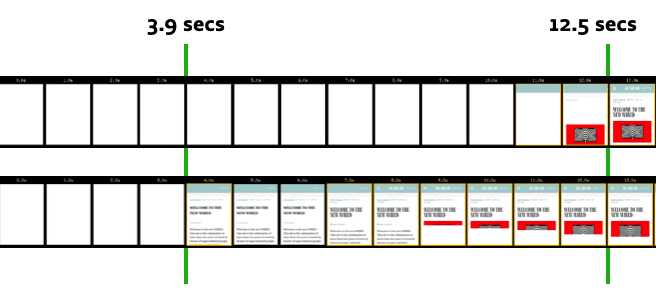
Before and after, compared in one image.
Interestingly, the page ends up rendering to its intentional design in a about the same amount of time in both cases, but the optimized version is usable much much sooner.
Also, even after making these optimizations, both versions of the page still weighed about the same (8-9 megabytes). So just as a reminder, I did not optimize the size of any assets to get that improvement. But if I did, it would only help to make that page perform even better.
More weight doesn’t mean more wait!
Looking ahead…
Permalink to 'Looking ahead…'So these are some things we can do right now to improve the perceived performance of any browser that accesses our site. But workarounds are workarounds… it would be great if we didn’t need to do them. Thankfully, there are some standards-based changes afoot on the web that will eventually render these techniques unnecessary in browsers of today and the future.
One of those is the latest version of HTTP (version 2), which browsers and web servers are just beginning to support (some sites already use it today). HTTP2 brings features like Server Push, which will allow a webserver to respond to a request for an HTML page with not only that page’s HTML content, but also the files that it will need to render the page (such as CSS, JavaScript, fonts, and images). This amazing improvement will mean browsers can make much better use of that round trip to the server and back, and render pages very quickly without the need for inlining CSS and JavaScript. Other workarounds we’ve been using for years like image sprites, domain sharding, and concatenating files won’t be needed on HTTP2 either due to its dramatic improvements in streaming requests. Interesting stuff.
Of course, the switch to HTTP2 won’t happen overnight, as both servers and browsers need to speak the new protocol. Also, for many browsers the switch will never happen at all! For example, anyone who browses the web with Internet Explorer versions older than 11, Android 2, BlackBerry, and others, won’t be able to communicate in HTTP2 with sites. That means we’ll have to keep both protocols alive on our sites for a long time, and come up with strategies for taking advantage of HTTP2 features without hampering the experience for browsers that don’t understand it.
That kind of sounds like… progressive enhancement! Time will tell how these approaches will pan out alongside one another, and you can read more about what HTTP2 will bring here.
Thanks for reading!